
What's a Good Marathon Time?
There isn't a single answer, because exactly which time qualifies as "good" depends heavily on who you are. Age, gender, experience, and training history all matter.
However, it is possible to examine typical performances and trends and then compare your own performance to these in context.
World Records
Comparing oneself to world record performances can be disheartening, but it's a good starting point.
The marathon world record for men is 1:59:30 set by Sabastian Sawe in 2026.
The record for women is 2:09:56, and was set by Ruth Chepng'etich in 2024.
Average Marathon Times
The average marathon time for women is 4:48:05, and the average time for men is 4:37:07. Note that these averages are for runners across all ages. Our average marathon time page looks in more detail at average times according to age, gender, and country.
A Quick Comparison
Use the chart below to compare your performance to world record and average marathon times.
What's a Good Marathon for Your Age?
Runners typically get slower as they age. However, if you're a beginner you should continue to improve for many years, and indeed, it takes many years to build the endurance necessary to run your best marathon.
The Science
Many studies have examined the link between age and marathon performance.
- Analysis of over 387,000 Berlin Marathon race results between 2008 and 2018 revealed that women tend to peak in performance at 32 years of age, and men at 34 years of age.
- An investigation of single age records showed that marathon times tend to improve from the age of 5 to 20 years, remain similar up to the age of 35, and then decline as age progresses.
- A study that tracked 40 individual marathoners over several years revealed an average drop in performance of 0.67% per year.
Age Group Records
Use the interactive chart below to compare your time to age group world records for the marathon.
Age Grading
An age grading is a percentage value that takes into account your age, sex, and race distance. It's the perfect way to compare different performances between different runners.
The table below is typically used to judge the quality of an age-grading percentage:
| Percentage | Standard |
|---|---|
| 100% | World record |
| 90%+ | World class |
| 80%+ | National class |
| 70%+ | Regional class |
| 60%+ | Local class |
Our reverse age grading calculator can show you which marathon time you'd have to run in order to achieve any of these standards.
Mass Participation Events
Looking at stats for big marathon events can be very informative and give you a good idea of where you'd finish in the pack.
Boston Marathon 2025
The average (mean) finish time for all runners (28,409) at the 2025 Boston Marathon was 3:43:13.
For men, the average finish time was 3:33:31 (16,107 runners), and for women the average finish time was 3:56:02 (12,230 runners).
The table below shows how many men and women finished in different time brackets.
| Time bracket | Male | Female |
|---|---|---|
| 2–3 hrs | 4,285 | 385 |
| 3–4 hrs | 8,145 | 7,479 |
| 4–5 hrs | 2,677 | 3,103 |
| 5–6 hrs | 888 | 1,165 |
| 6–7 hrs | 111 | 97 |
| 7–8 hrs | 1 | 1 |
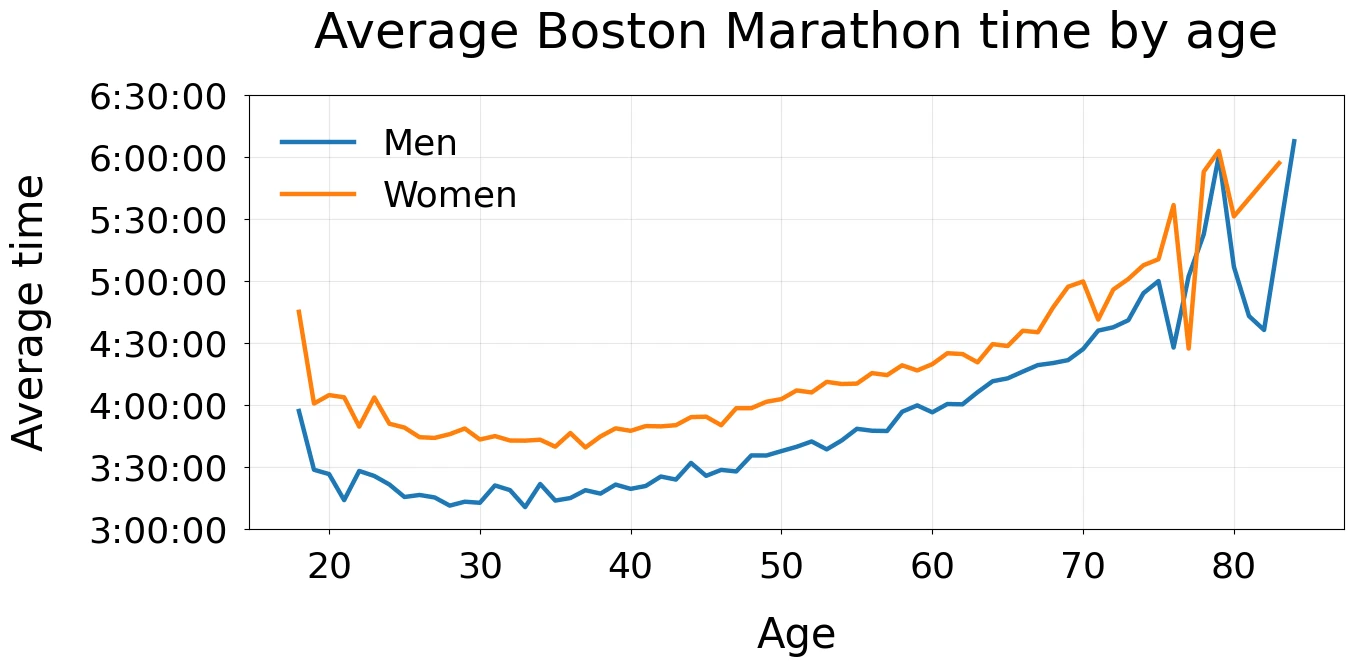
The graph below shows the average Boston finish times for men and women of each age.
Paris Marathon 2025
The Boston Marathon is definitely one of the faster mass participation events. The average times for the Paris Marathon are quite a bit slower and probably a better reflection of what the general population runs.
The average finish time for all runners (54,934) at the 2025 Paris Marathon was 4:11:46.
For men, the average finish time was 4:03:43 (38,589 runners), and for women the average finish time was 4:30:47 (16,345 runners).
The table below shows how many men and women finished in different time brackets.
| Time bracket | Male | Female |
|---|---|---|
| 2–3 hrs | 1,992 | 44 |
| 3–4 hrs | 18,208 | 4,021 |
| 4–5 hrs | 14,435 | 8,652 |
| 5–6 hrs | 3,529 | 3,191 |
| 6–7 hrs | 390 | 400 |
| 7–8 hrs | 31 | 32 |
| 8–9 hrs | 3 | 4 |
| 9–10 hrs | 1 | 1 |
Club Standards
Some running clubs offer a set of standards for different race distances, ages, and genders.
For example, Knowsley Harriers has Platinum, Gold, Silver, Bronze, and Copper standards. As an example, a 40-year-old woman would need to run 2:50:59 to achieve Platinum standard, 3:12:21 for Gold, 3:33:44 for Silver, 3:55:06 for Bronze, and 4:23:36 for Copper.
Comparison with Yourself
Comparing yourself to past performances is possibly the best way to judge your efforts.
But do remember that you should never judge your ability based on a single recent performance. Many many runners have bad races, and this is especially true for marathons.
Other Distances
Equivalent performances are a useful way of judging a performance for one distance based on what you know about another distance. See our race predictor tool which allows you to enter a race time for one distance and find out what you should expect for other distances.
Other Performance Measures
Our Race Profile tool provides a wealth of information about your race performance, including comparisons, trivia, scores, splits, averages, metrics, and more.